Overview
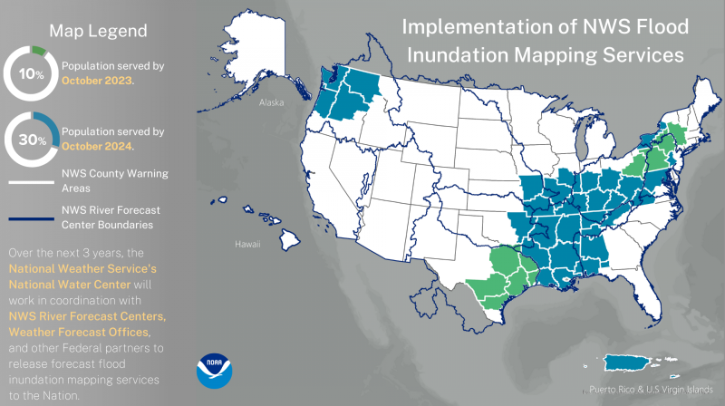
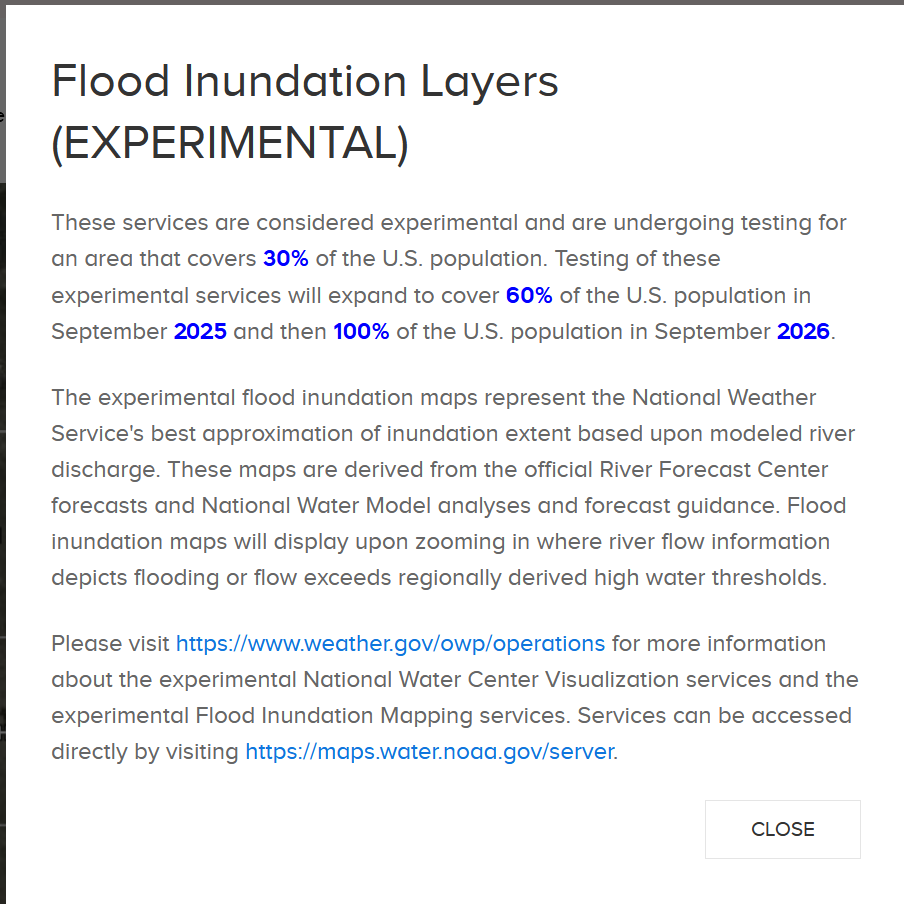
The National Water Center has successfully rolled out Flood Inundation Mapping (FIM) for 30% of the U.S. population, covering parts of eastern Texas, the Southern Plains, Mid-Mississippi Valley, Tennessee Valley, Ohio River Valley, Mid-Atlantic, and southern portions of the Northeast. FIM services are also available in the Pacific Northwest and Puerto Rico. Unlike previous iterations of flood maps, this new service estimates flooded areas not only for large rivers and gauged streams but also for smaller creeks, bayous, and headwater streams within the domain.
Set-Up
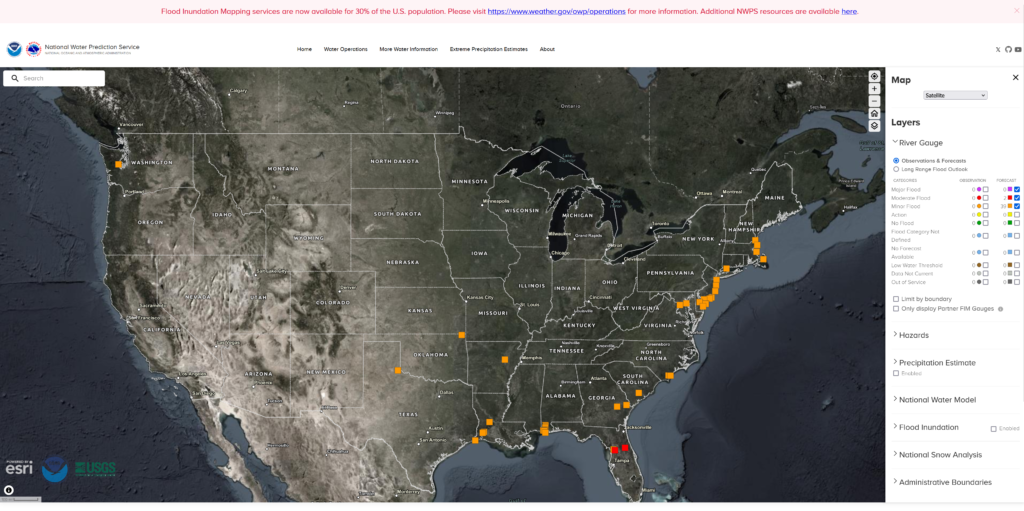
To access these services, point your browser to the National Water Prediction Service (NWPS) homepage. NWPS has replaced the venerable Advanced Hydrologic Prediction Service (AHPS). Upon arrival, you’ll see the nation’s stream gauges with both observed and forecast stream conditions displayed.
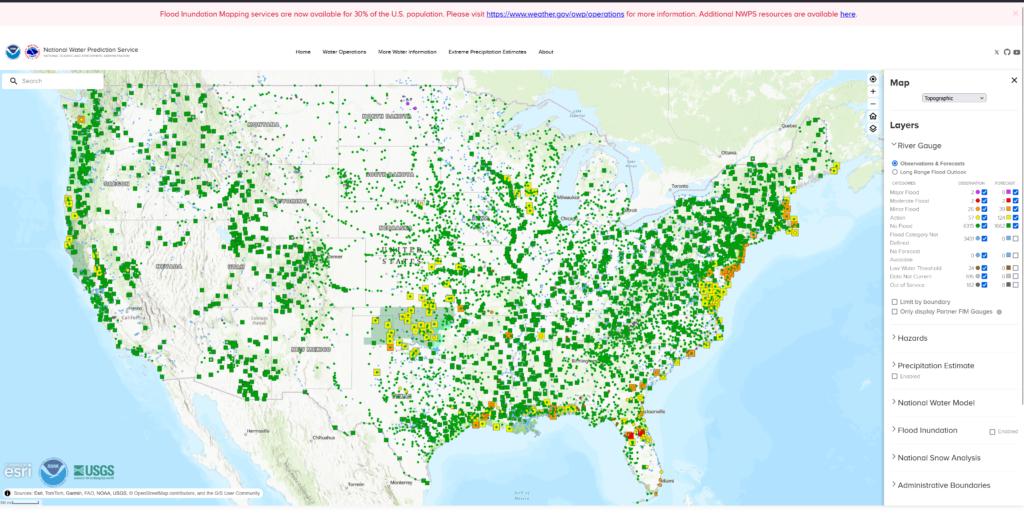
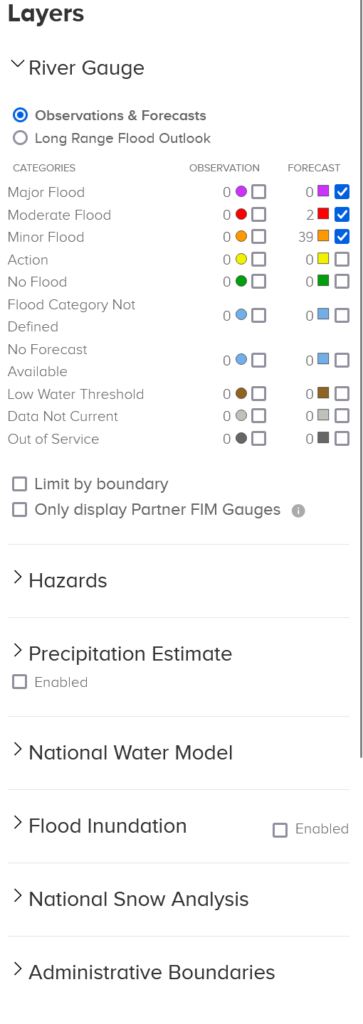
The larger icons indicate forecast stream conditions (e.g., Action Stage, Minor Flooding), while the smaller icon represents the current condition.
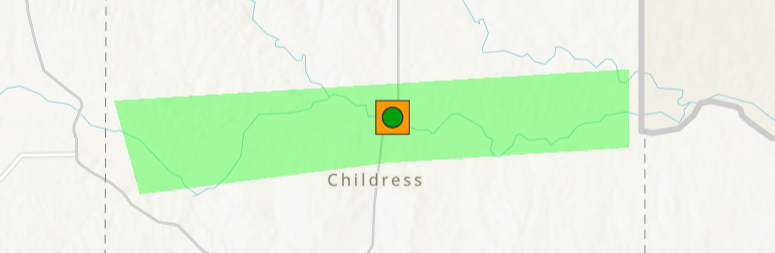
In this example, a Flood Warning polygon appears over a stream forecast for Minor Flooding, although its current condition is normal/no flood.
To use the FIM services effectively, it’s helpful to prepare the map first. In the upper-right corner, switch the map from “Topographic” to “Satellite.” If flooding hasn’t yet begun, you can disable current stream conditions by clicking “Observations” in the legend. Alternatively, uncheck each box individually. Then, turn off all forecast stream conditions except for Minor, Moderate, and Major Flood categories using the checkboxes under “Forecast.”
Below is an example of a customized map set up to view the new FIM services
Flood Mapping!
To use the FIM services effectively, it’s helpful to prepare the map first. In the upper-right corner, switch the map from “Topographic” to “Satellite.” If flooding hasn’t yet begun, you can disable current stream conditions by clicking “Observations” in the legend. Alternatively, uncheck each box individually. Then, turn off all forecast stream conditions except for Minor, Moderate, and Major Flood categories using the checkboxes under “Forecast.”
Below is an example of a customized map set up to view the new FIM services:
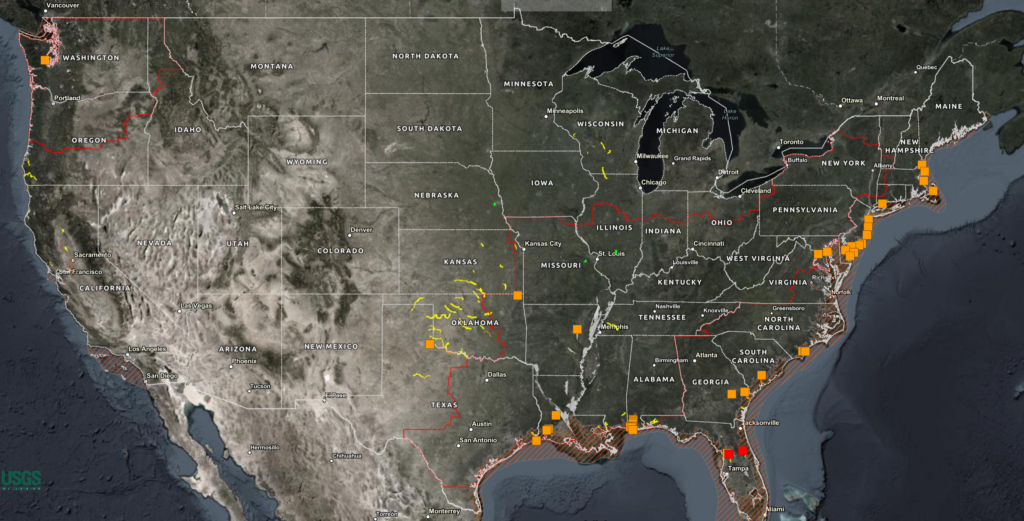
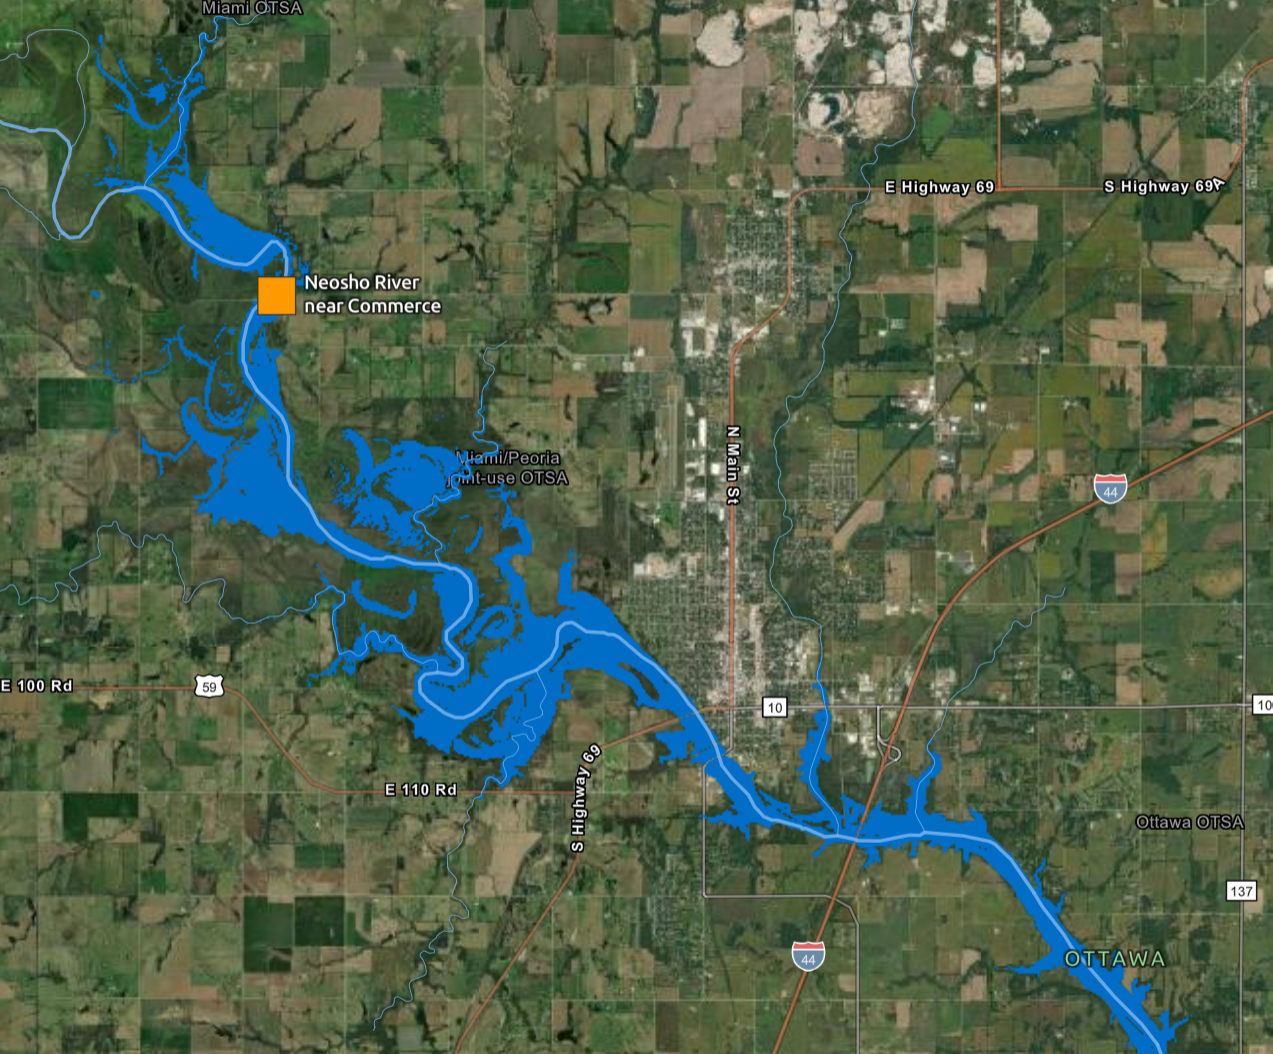
By default, NWPS activates the “RFC Max Forecast” FIM. This version uses River Forecast Center (RFC) streamflow forecasts routed through the National Water Model to generate flood inundation maps. FIM will only display within the red polygons and for stream segments forecast or observed to be in Minor, Moderate, or Major Flood stages.
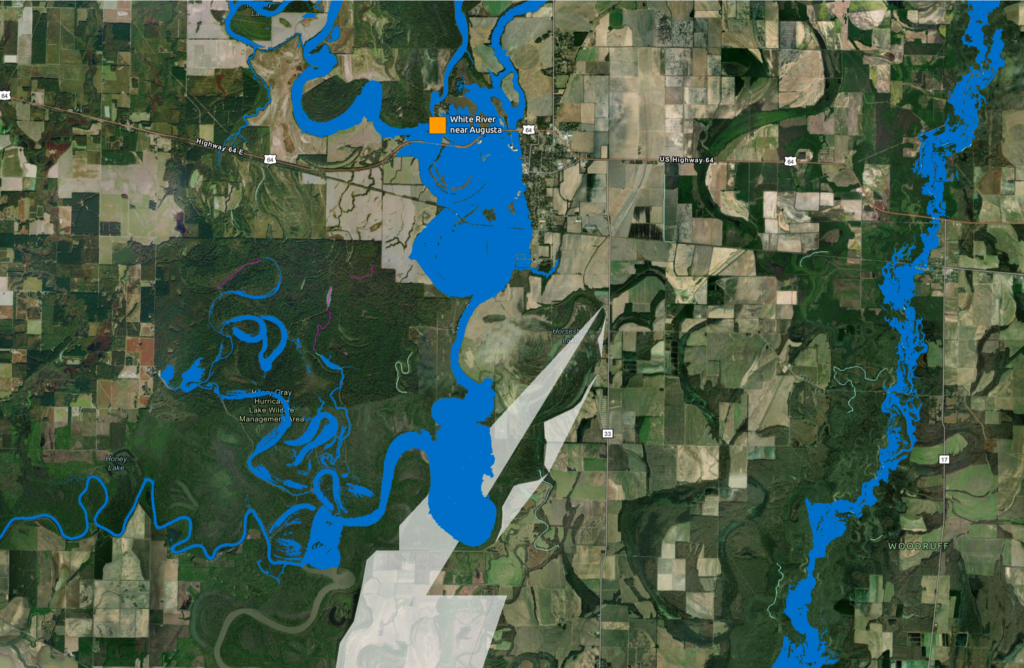
Within the 30% population coverage area, only a few Minor flood forecasts are currently active. Let’s examine the White River near Augusta, Arkansas, which is forecast for minor flooding. In the image below, forecast flood stage primarily impacts wetlands. Although the impacts are limited, hunters may find this useful when planning where to set up a blind or stand.
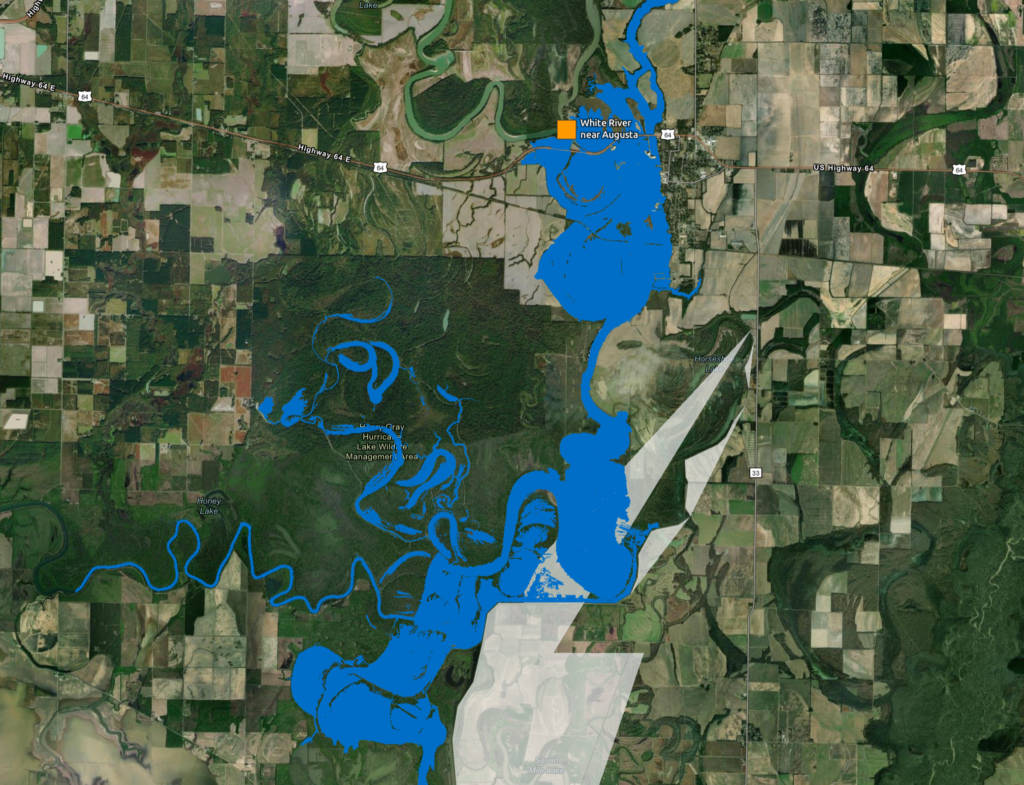
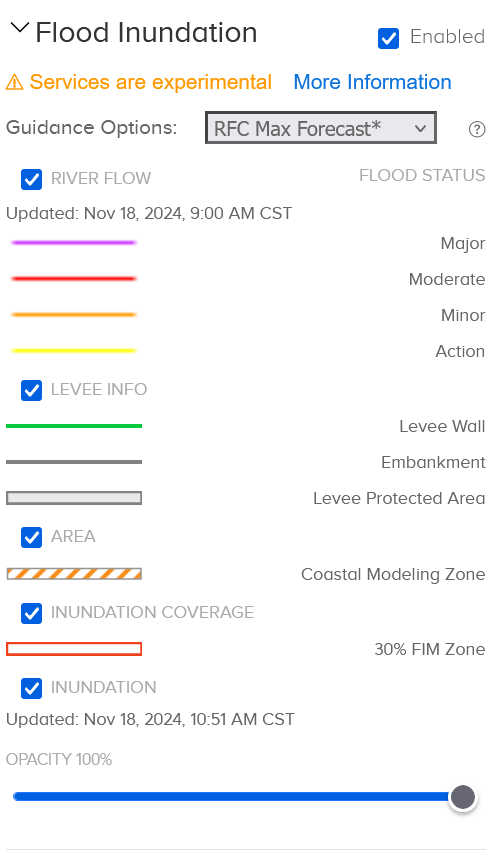
A grey polygon shows a levee-protected area where inundation is not expected. The FIM service’s timestamp (e.g., 10:51 AM CST) is also critical—check the associated stream gauge hydrograph to compare forecast issuance times. It typically takes 1–2 hours for forecasts to be integrated into the FIM.
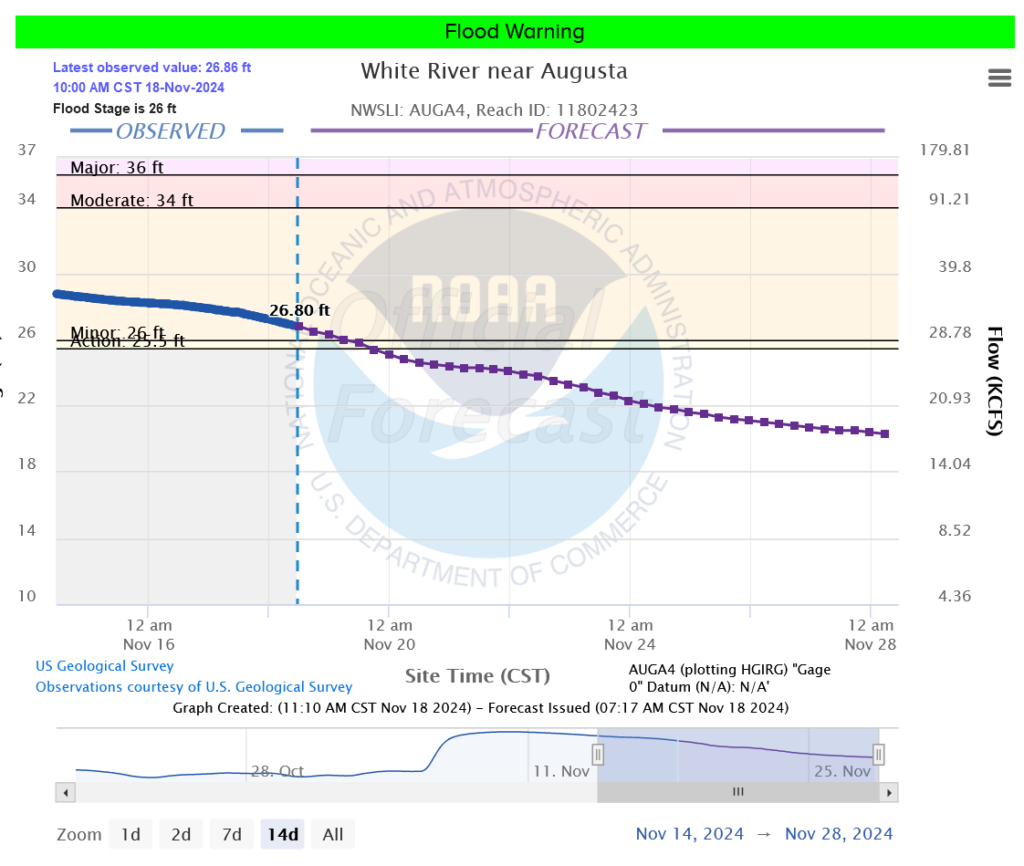
Below the hydrograph, you’ll see how much forecast precipitation is included (e.g., 24, 48, or 72 hours). For the Augusta gauge, only 24 hours of precipitation is included—meaning any major weather systems beyond that timeframe aren’t yet considered.
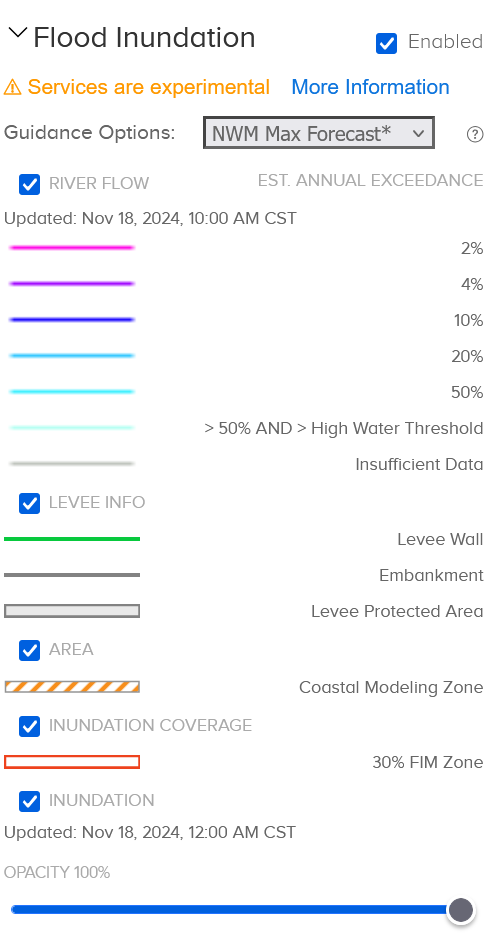
To explore further, use the “Guidance Options” drop-down to select “NWM Max Forecast.” This uses the National Water Model (NWM) with GFS precipitation forcing, extending out 5 days. Instead of using flood stage categories, this view highlights streams based on Annual Exceedance Probability (AEP). For example, a 100-year flood (~1% AEP) means there’s a 1% chance it could occur in any given year.
The NWM maps flood extents from the High Water Threshold (regionally determined) to a 2% AEP. In the example image, NWM Max Forecast also shows inundation on the Cache River east of the White River. That segment doesn’t appear in the RFC version because it either isn’t forecast to exceed Minor Flood or isn’t forecast at all. Conversely, the NWM doesn’t show inundation south of the confluence—likely because it doesn’t detect streamflow high enough to cross the threshold.
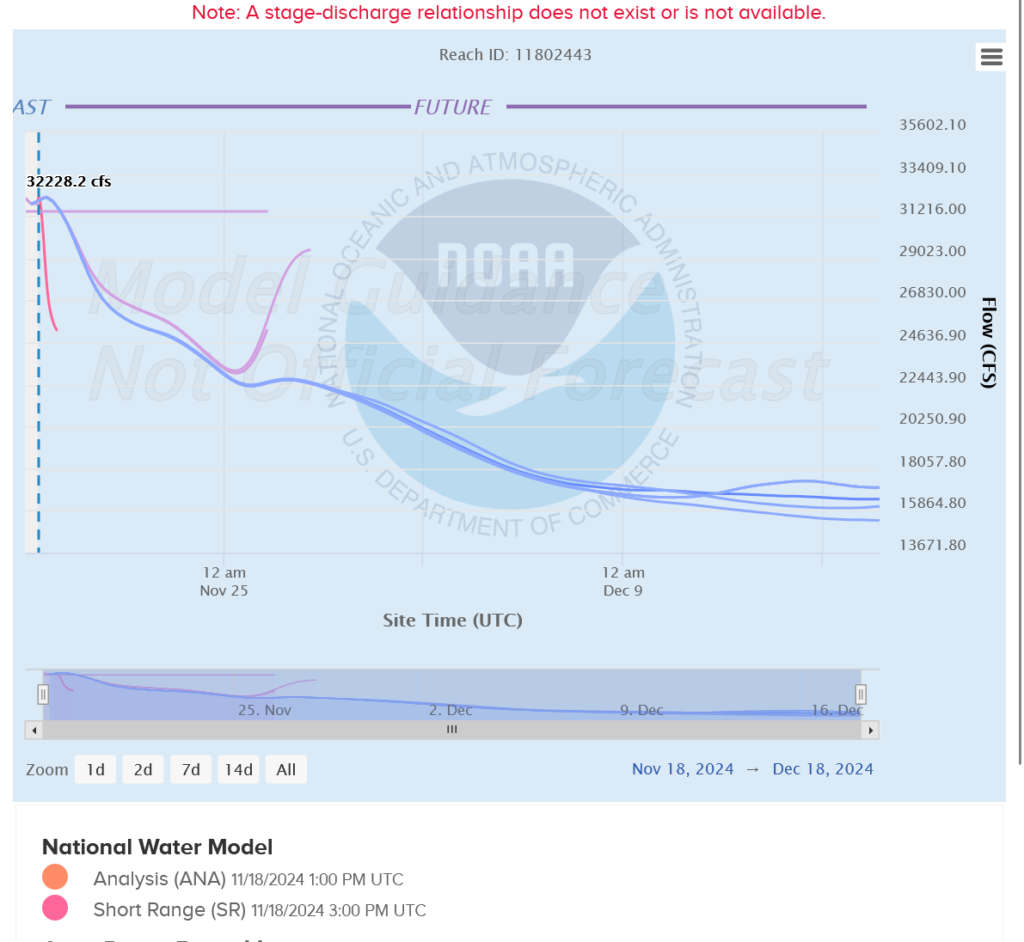
You can also activate the National Water Model layer in the main legend to highlight clickable streams in the NWM network. These can provide detailed medium and long-range forecast hydrographs.
For example, the forecast shows recession until next Monday, when some ensemble members indicate renewed river rises.
If you enable the National Water Model layer, you can view FIM in areas where streams are highlighted within the boundary—even if they are ungauged or not currently forecasted for flooding.
One such example is a 50% AEP event forecasted on the Green River near McLean, KY. Zooming in reveals the modeled inundation extent.
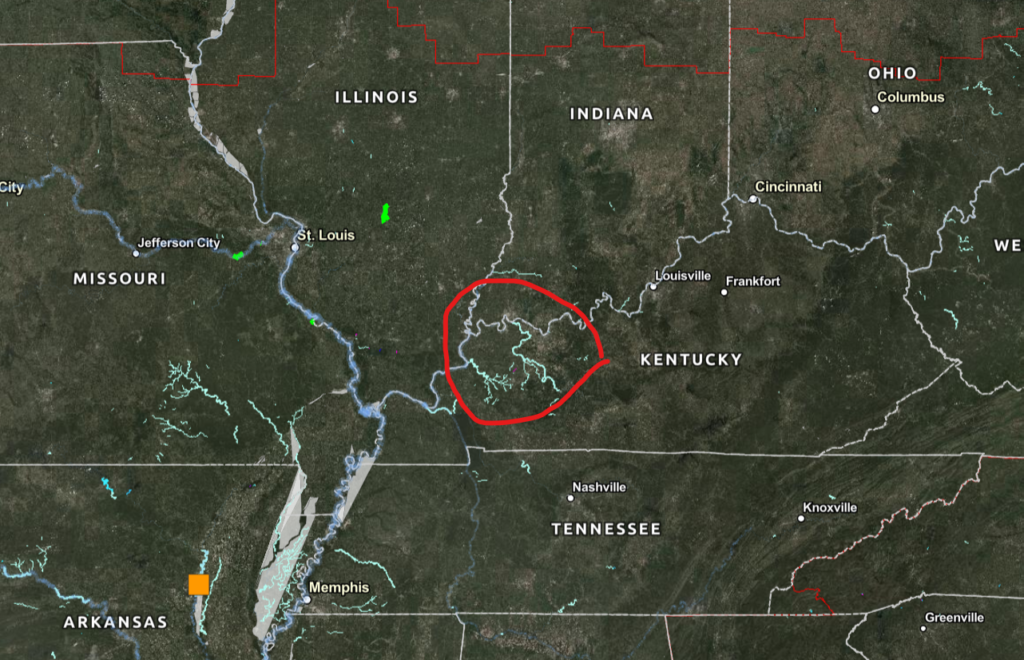
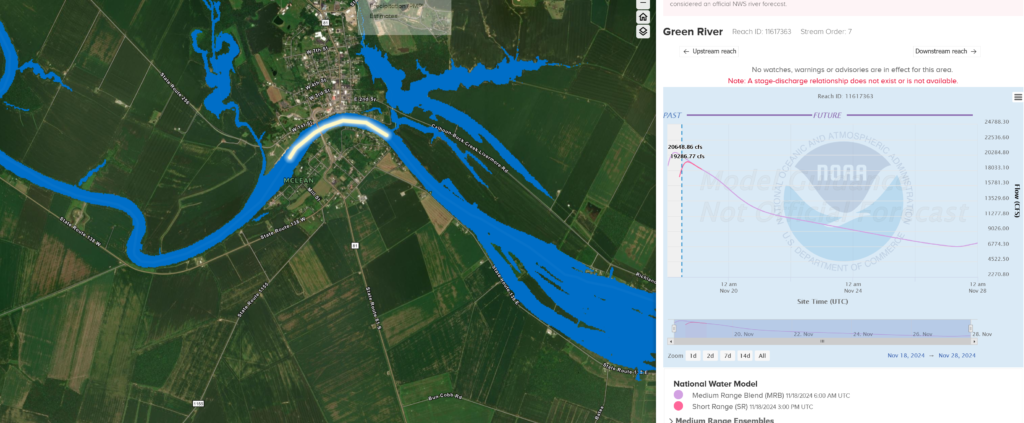
National Water Model is signaling 50% AEP flow on the Green River near McClean, KY. If we zoom in, we can see what that looks like in the model.
Final Thoughts
When reviewing these modeled FIM maps, keep the following in mind:
- National Water Model-based FIMs are deterministic and subject to run-to-run variability. Use them as guidance.
- RFC forecasts may not include the full rain event, especially if forecast precipitation duration is limited.
- This is an experimental service, and inaccuracies are expected—especially in urban areas where the model may misrepresent drainage infrastructure.
Despite these limitations, this service represents a revolutionary tool for the National Weather Service, emergency managers, and citizens alike to anticipate and respond to flood risks more effectively.
No responses yet